Note
Go to the end to download the full example code.
Returning a generator in joblib.Parallel#
This example illustrates memory optimization enabled by using
joblib.Parallel to get a generator on the outputs of parallel jobs.
We first create tasks that return results with large memory footprints.
If we call Parallel for several of these tasks directly, we
observe a high memory usage, as all the results are held in RAM before being
processed
Using return_as='generator' allows to progressively consume the outputs
as they arrive and keeps the memory at an acceptable level.
In this case, the output of the Parallel call is a generator that yields the
results in the order the tasks have been submitted with. If the order of the
tasks does not matter (for instance if they are consumed by a commutative
aggregation function), then using return_as='generator_unordered' can be
even more efficient.
MemoryMonitor helper#
The following class is an helper to monitor the memory of the process and its children in another thread, so we can display it afterward.
We will use psutil to monitor the memory usage in the code. Make sure it
is installed with pip install psutil for this example.
import time
from threading import Thread

from psutil import Process


class MemoryMonitor(Thread):
    """Monitor the memory usage in MB in a separate thread.

    Note that this class is good enough to highlight the memory profile of
    Parallel in this example, but is not a general purpose profiler fit for
    all cases.
    """

    def __init__(self):
        super().__init__()
        self.stop = False
        self.memory_buffer = []
        self.start()

    def get_memory(self):
        "Get memory of a process and its children."
        p = Process()
        memory = p.memory_info().rss
        for c in p.children():
            memory += c.memory_info().rss
        return memory

    def run(self):
        memory_start = self.get_memory()
        while not self.stop:
            self.memory_buffer.append(self.get_memory() - memory_start)
            time.sleep(0.2)

    def join(self):
        self.stop = True
        super().join()
Save memory by consuming the outputs of the tasks as fast as possible#
We create a task whose output takes about 15MB of RAM.
import numpy as np


def return_big_object(i):
    time.sleep(0.1)
    return i * np.ones((10000, 200), dtype=np.float64)
We create a reduce step. The input will be a generator on big objects
generated in parallel by several instances of return_big_object.
def accumulator_sum(generator):
    result = 0
    for value in generator:
        result += value
        print(".", end="", flush=True)
    print("")
    return result
We process many of the tasks in parallel. If return_as="list" (default),
we should expect a usage of more than 2GB in RAM. Indeed, all the results
are computed and stored in res before being processed by
accumulator_sum and collected by the gc.
from joblib import Parallel, delayed

monitor = MemoryMonitor()
print("Running tasks with return_as='list'...")
res = Parallel(n_jobs=2, return_as="list")(
    delayed(return_big_object)(i) for i in range(150)
)
print("Accumulate results:", end="")
res = accumulator_sum(res)
print("All tasks completed and reduced successfully.")

# Report memory usage
del res  # we clean the result to avoid memory border effects
monitor.join()
peak = max(monitor.memory_buffer) / 1e9
print(f"Peak memory usage: {peak:.2f}GB")
Running tasks with return_as='list'...
Accumulate results:......................................................................................................................................................
All tasks completed and reduced successfully.
Peak memory usage: 2.46GB
If we use return_as="generator", res is simply a generator on the
results that are ready. Here we consume the results as soon as they arrive
with the accumulator_sum and once they have been used, they are collected
by the gc. The memory footprint is thus reduced, typically around 300MB.
monitor_gen = MemoryMonitor()
print("Create result generator with return_as='generator'...")
res = Parallel(n_jobs=2, return_as="generator")(
    delayed(return_big_object)(i) for i in range(150)
)
print("Accumulate results:", end="")
res = accumulator_sum(res)
print("All tasks completed and reduced successfully.")

# Report memory usage
del res  # we clean the result to avoid memory border effects
monitor_gen.join()
peak = max(monitor_gen.memory_buffer) / 1e6
print(f"Peak memory usage: {peak:.2f}MB")
Create result generator with return_as='generator'...
Accumulate results:......................................................................................................................................................
All tasks completed and reduced successfully.
Peak memory usage: 148.10MB
We can then report the memory usage across time of the two runs using the MemoryMonitor.
In the first case, as the results accumulate in res, the memory grows
linearly and it is freed once the accumulator_sum function finishes.
In the second case, the results are processed by the accumulator as soon as they arrive, and the memory does not need to be able to contain all the results.
import matplotlib.pyplot as plt

plt.figure(0)
plt.semilogy(np.maximum.accumulate(monitor.memory_buffer), label='return_as="list"')
plt.semilogy(
    np.maximum.accumulate(monitor_gen.memory_buffer), label='return_as="generator"'
)
plt.xlabel("Time")
plt.xticks([], [])
plt.ylabel("Memory usage")
plt.yticks([1e7, 1e8, 1e9], ["10MB", "100MB", "1GB"])
plt.legend()
plt.show()
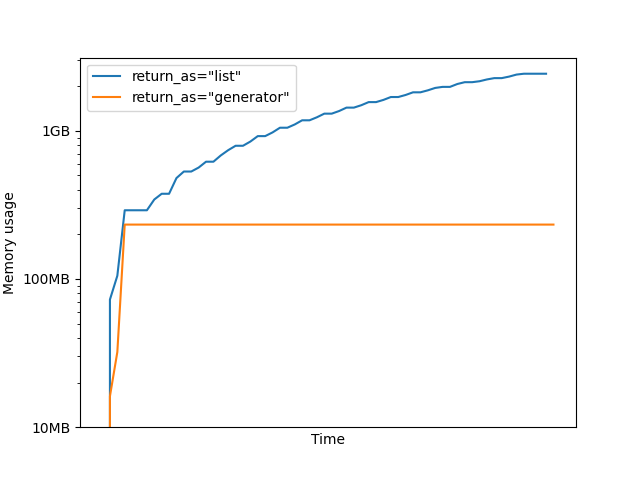
It is important to note that with return_as="generator", the results are
still accumulated in RAM after computation. But as we asynchronously process
them, they can be freed sooner. However, if the generator is not consumed
the memory still grows linearly.
Further memory efficiency for commutative aggregation#
There is still room for improving the relief on memory allocation we get
using return_as="generator". Indeed, notice how the generator of the
previous example respects the order the tasks have been submitted with. This
behavior can cause a build up in memory of results waiting to be consumed,
in case some tasks finished before other tasks despite being submitted
later. The corresponding results will be kept in memory until the slower
tasks submitted earlier are done and have been iterated over.
In case the downstream consumer of the results is reliant on the assumption
that the results are yielded in the same order that the tasks were submitted,
it can’t be helped. But in our example, since the + operator is
commutative, the function accumulator_sum does not need the generator to
return the results with any particular order. In this case it’s safe to use
the option return_as="generator_unordered", so that the results are
returned as soon as a task is completed, ignoring the order of task
submission.
Beware that the downstream consumer of the results must not expect them be returned with any deterministic or predictable order at all, since the progress of the tasks can depend on the availability of the workers, which can be affected by external events, such as system load, implementation details in the backend, etc.
To better highlight improvements in memory usage when using the parameter
return_as="generator_unordered", let’s explicitly add delay in some of
the submitted tasks.
def return_big_object_delayed(i):
    if (i + 20) % 60:
        time.sleep(0.1)
    else:
        time.sleep(5)
    return i * np.ones((10000, 200), dtype=np.float64)
Let’s check memory usage when using return_as="generator"…
monitor_delayed_gen = MemoryMonitor()
print("Create result generator on delayed tasks with return_as='generator'...")
res = Parallel(n_jobs=2, return_as="generator")(
    delayed(return_big_object_delayed)(i) for i in range(150)
)
print("Accumulate results:", end="")
res = accumulator_sum(res)
print("All tasks completed and reduced successfully.")

# Report memory usage
del res  # we clean the result to avoid memory border effects
monitor_delayed_gen.join()
peak = max(monitor_delayed_gen.memory_buffer) / 1e6
print(f"Peak memory usage: {peak:.2f}MB")
Create result generator on delayed tasks with return_as='generator'...
Accumulate results:......................................................................................................................................................
All tasks completed and reduced successfully.
Peak memory usage: 462.54MB
If we use return_as="generator_unordered", res will not enforce any
order when returning the results, and will simply enable iterating on the
results as soon as it’s available. The peak memory usage is now controlled
to an even lower level, since that results can be consumed immediately
rather than being delayed by the compute of slower tasks that have been
submitted earlier.
monitor_delayed_gen_unordered = MemoryMonitor()
print(
    "Create result generator on delayed tasks with return_as='generator_unordered'..."
)
res = Parallel(n_jobs=2, return_as="generator_unordered")(
    delayed(return_big_object_delayed)(i) for i in range(150)
)
print("Accumulate results:", end="")
res = accumulator_sum(res)
print("All tasks completed and reduced successfully.")

# Report memory usage
del res  # we clean the result to avoid memory border effects
monitor_delayed_gen_unordered.join()
peak = max(monitor_delayed_gen_unordered.memory_buffer) / 1e6
print(f"Peak memory usage: {peak:.2f}MB")
Create result generator on delayed tasks with return_as='generator_unordered'...
Accumulate results:......................................................................................................................................................
All tasks completed and reduced successfully.
Peak memory usage: 146.57MB
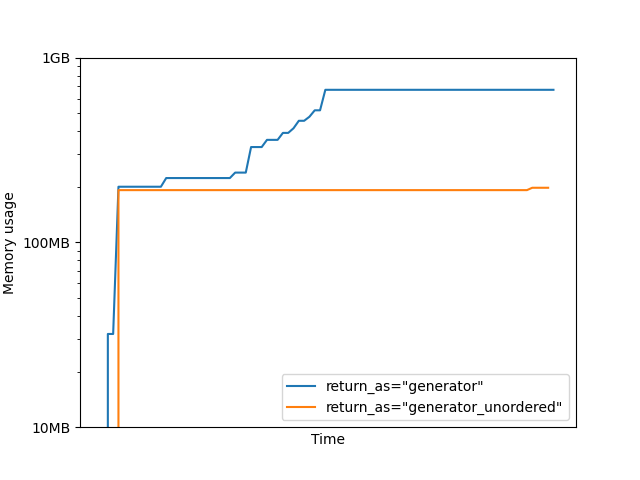
Notice how the plot for 'return_as="generator' now shows a high memory
usage plateau when slow jobs cause a congestion of intermediate results
waiting in RAM before in-order aggregation. This high memory usage is never
observed when using 'return_as="generator_unordered".
plt.figure(1)
plt.semilogy(
    np.maximum.accumulate(monitor_delayed_gen.memory_buffer),
    label='return_as="generator"',
)
plt.semilogy(
    np.maximum.accumulate(monitor_delayed_gen_unordered.memory_buffer),
    label='return_as="generator_unordered"',
)
plt.xlabel("Time")
plt.xticks([], [])
plt.ylabel("Memory usage")
plt.yticks([1e7, 1e8, 1e9], ["10MB", "100MB", "1GB"])
plt.legend()
plt.show()
Total running time of the script: (0 minutes 53.774 seconds)